
How I sped up the PNG export in darktable using perf
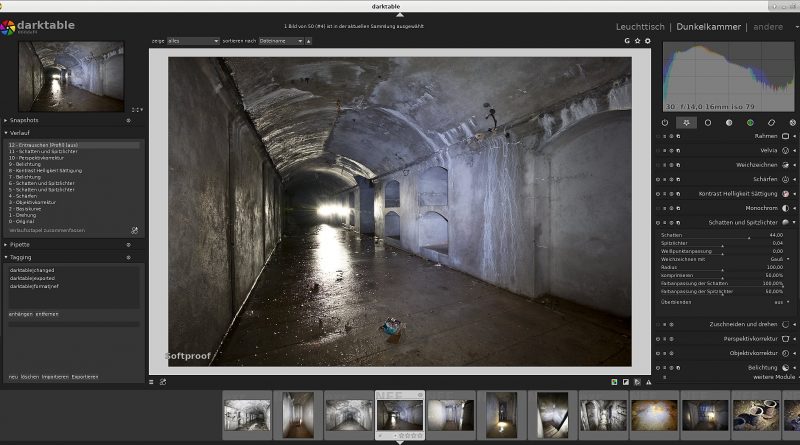
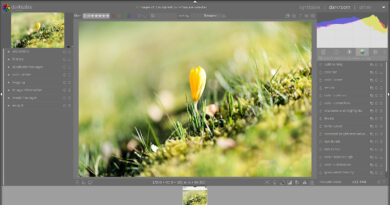
I do a lot of photo editing nowadays, mostly for my travel blog over at One Man, One Map. My workflow is centered around darktable, but instead of exporting to JPEG format I export 16-bit PNGs so I can pass the images through some additional scripts and move the lossy compression step to the very last moment. I’ve always had the impression that the PNG export might be slower than it has to be, but it had become a real issue since I’ve upgraded my desktop PC to a six-core Ryzen 7 1600X CPU and an NVIDIA GTX 950 GPU.
darktable uses OpenMP for multithreading, and OpenCL to offload most image processing routines to the GPU. I had checked that both strategies were actually working, but exporting one of my Nikon D750 RAW images at full 24 megapixel resolution with the usual processing modules applied took up to twelve seconds. That just wasn’t acceptable. I wouldn’t expect my old Intel Core i5-5300U ultrabook to do well in this benchmark, but it processed the same image in about 18 seconds. Exporting to JPEG was much faster, taking less than two seconds on the PC and about eight on the ultrabook.
Finding the problem
Since I had never worked with the darktable codebase before, I decided to use other existing means for profiling the application first. darkable has a built-in performance debugging mode which can be enabled by running darktable -d perf in a terminal. Here’s a sample output from the ultrabook:
[export] creating pixelpipe took 0.112 secs (0.240 CPU)
[dev_pixelpipe] took 0.023 secs (0.041 CPU) initing base buffer [export]
[dev_pixelpipe] took 0.018 secs (0.019 CPU) processed `raw black/white point' on CPU, blended on CPU [export]
[dev_pixelpipe] took 0.019 secs (0.027 CPU) processed `white balance' on CPU, blended on CPU [export]
[dev_pixelpipe] took 0.016 secs (0.023 CPU) processed `highlight reconstruction' on CPU, blended on CPU [export]
[dev_pixelpipe] took 1.025 secs (2.687 CPU) processed `demosaic' on CPU, blended on CPU [export]
[dev_pixelpipe] took 0.038 secs (0.089 CPU) processed `exposure' on CPU, blended on CPU [export]
[dev_pixelpipe] took 2.283 secs (6.161 CPU) processed `lens correction' on CPU, blended on CPU [export]
[dev_pixelpipe] took 0.876 secs (2.300 CPU) processed `perspective correction' on CPU, blended on CPU [export]
[dev_pixelpipe] took 0.073 secs (0.139 CPU) processed `base curve' on CPU, blended on CPU [export]
[dev_pixelpipe] took 0.065 secs (0.155 CPU) processed `input color profile' on CPU, blended on CPU [export]
[dev_pixelpipe] took 0.730 secs (1.915 CPU) processed `shadows and highlights' on CPU, blended on CPU [export]
[dev_pixelpipe] took 0.075 secs (0.186 CPU) processed `contrast brightness saturation' on CPU, blended on CPU [export]
[dev_pixelpipe] took 0.168 secs (0.413 CPU) processed `sharpen' on CPU, blended on CPU [export]
[dev_pixelpipe] took 0.160 secs (0.423 CPU) processed `output color profile' on CPU, blended on CPU [export]
[dev_pixelpipe] took 0.048 secs (0.121 CPU) processed `gamma' on CPU, blended on CPU [export]
[dev_process_export] pixel pipeline processing took 5.619 secs (14.702 CPU)
[export_job] exported to `/home/mr2515/Bilder/2017/2017-08-11 Bunker Burgeis/bearbeitet/_DSC9303_20.png'
According to the second last line, image processing took 5.619 seconds, but in reality it took about ten seconds until the output file was complete. Sadly the export step is not being accounted for, so there might be something wrong here, but what? Converting a picture of this size to PNG format shouldn’t take an additional five seconds, not even on this slow CPU.
The next step was to use perf to check what darktable was spending its time on. It is a performance-counter-based profiling tool which has been available on Linux for a couple of years now, but doesn’t seem to be very well-known outside of some niches.
There are two different approaches to software profiling: Sampling and Instrumentation. Sampling is an external method, so the program code and binary don’t have to be changed. Some component (in this case the kernel) looks at the value of the instruction pointer of the application in regular intervals, and some other component (in this case the perf command line tool) can take all the debugging information available on the system and try to find out which instruction or code block the instruction pointer was pointing to at a given moment. Since the sampling interval is much lower than the clock rate of the CPU, the output is only a statistic and inaccurate, but accurate enough to see if the application is spending a lot of time in the same block of code.
Instrumentation tools like gprof (which requires some help from the compiler) on the other hand change the program code and have it emit profiling information every time something happens. So these are highly accurate, and I did have the source code at hand, but I didn’t see a reason to rebuild the whole binary when Sampling should already be able to give me the answer. (perf can do much more than I’m showing here, and can also do some instrumentation, BTW. Head over to Brendan Greg’s page to get a feeling for what’s possible.)
I executed perf top -p 16461 (16461 was the process id of my darktable instance), started a PNG export, and waited for it to finish.
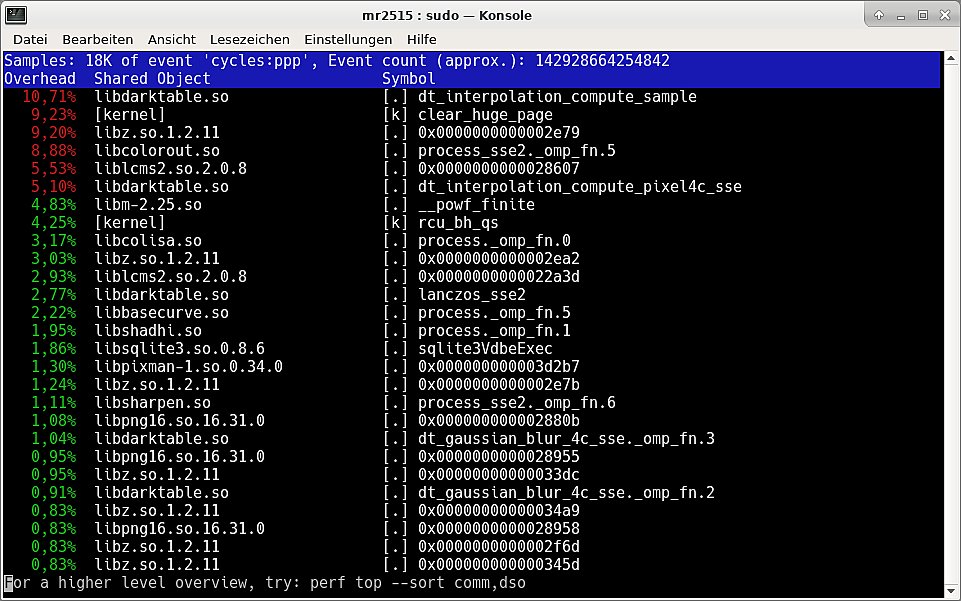
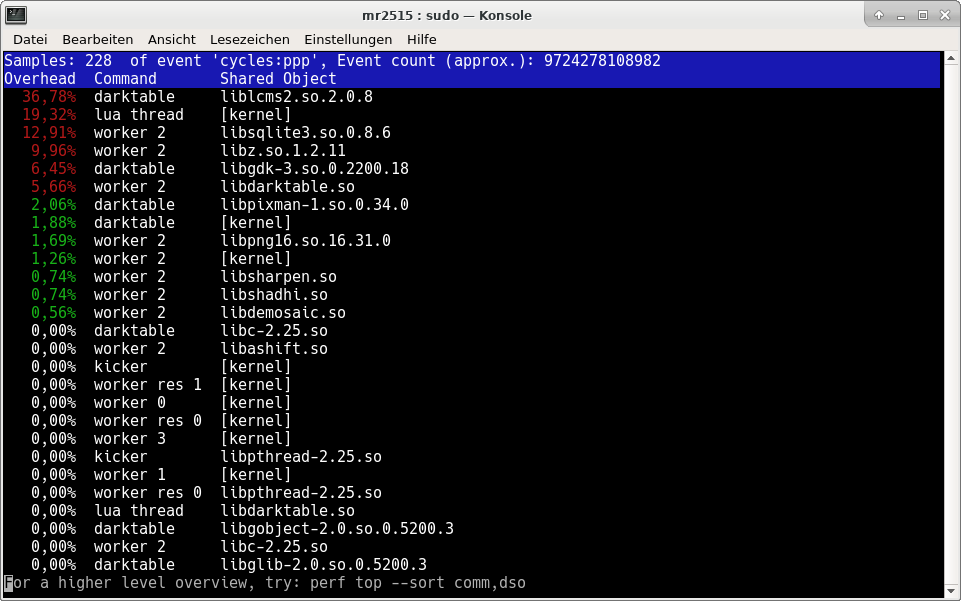
The percentage values are relative to the observation period, so make sure to start perf top shortly before the event it is supposed to observe and stop it shortly after. Also you only get to see the symbol names if your binaries still have symbols, otherwise you only see addresses. If you were not interested in function names, but just “full-blown components” like libraries, you could have used perf top -p 16461 --sort comm,dso:
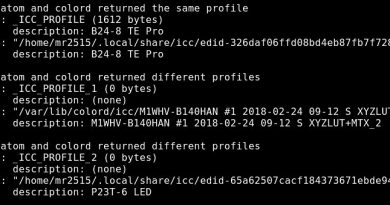
The output did mostly look as expected: 10.71% was spent in dt_interpolation_compute_sample inside libdarktable.so, which is one of the core methods of the lens correction module. According to darktable’s own profiling output, 2.687 out of 5.619 seconds were spent in this module, so no surprise here. 9.23% spent in clear_huge_page inside the kernel seemed to be a bit of a “memory management artifcat”, and the time spent in libcolorout.so and liblcms2.so.2.0.8 seemed to be attributable to image processing as well. But 9.20% spent in libz.so.1.2.11 didn’t seem right. That was about as much time as darktable spent on its heaviest image processing step. Who even called libz?
The problem
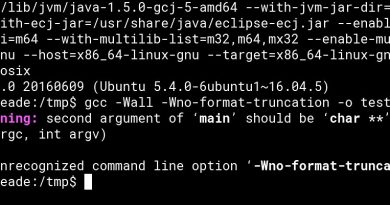
Turns out libpng, which darktable uses to export to PNG format, uses libz for compression. And the compression level was hard-coded to maximum in src/imageio/format/png.c:
png_set_compression_level(png_ptr, Z_BEST_COMPRESSION);
This caused two different issues. The first one was that Z_BEST_COMPRESSION is equivalent to compression level 9. Compression levels above level 5 usually don’t result in a much smaller output file with libz, but heavily increase the number of cycles spent on compression. When I work with huge pictures (e.g. stitched panoramas larger than 50 megapixels), I often even disable the PNG/TIFF compression because I don’t really care about the storage space and an SSD can read/write the data fast enough, but I do care about the compression overhead. A compression level between 3 and 5 should be okay for most uses, IMO, but would be much faster than level 9.
The other issue was the single-threaded nature of libz. It simply doesn’t use more than one CPU (core), the programmer has to set that up manually and it’s not trivial. So not many do it, and this became a nice display of Amdahl’s Law: As you parallelize everything that can be parallelized, the one thing that isn’t starts to weigh in more and more. The faster your machine is, the more this becomes noticeable. Here are some simplified graphs:
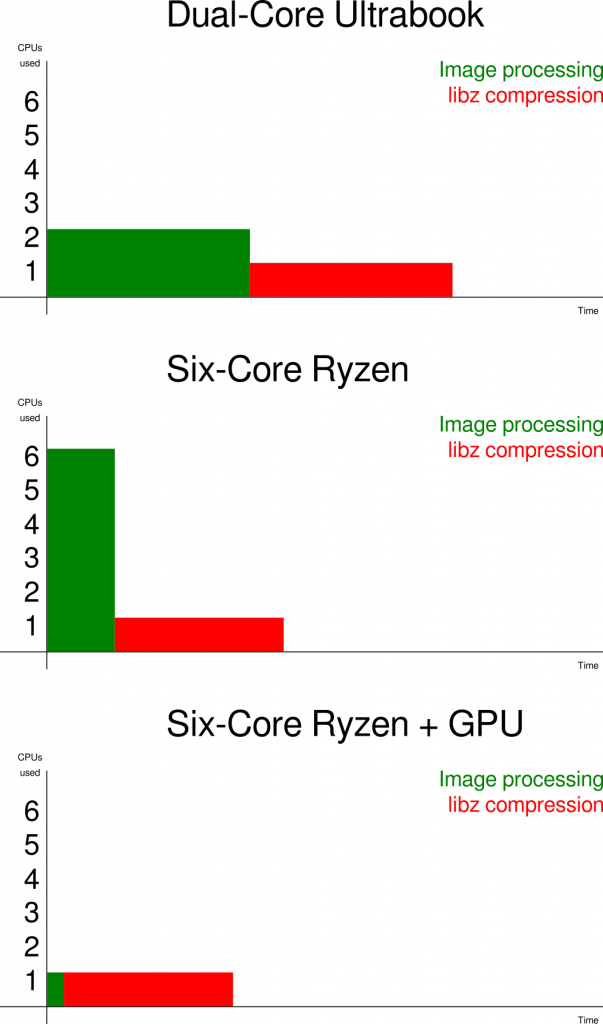
You can speed the image processing step all you want, but you can’t get the total time below the time spent on compressing the data at a senselessly high compression level on a single core.
The solution(s)
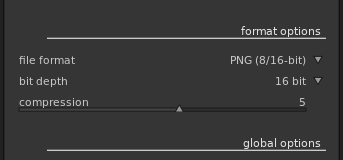
The perfect solution would have been to parallelize compression as well, so people who really want/need the highest compression level get something out of this as well. But that would have been hard, since darktable doesn’t call into libz itself, but only through libpng, and libpng too is not multithreaded. So I decided to simply add a “Compression” slider to darktable’s PNG output module, making the compression level configurable, and set the default to 5.
This lowers the average time for converting an image on my Ryzen+GPU system from twelve seconds to less than two, which is the difference between “I’ll go make some coffee until this is over” and “I don’t really notice the export step anymore”. Tobias Ellinghaus was nice enough to clean up my patch and merge it into darktable master within a day.
thank you for this informative post.